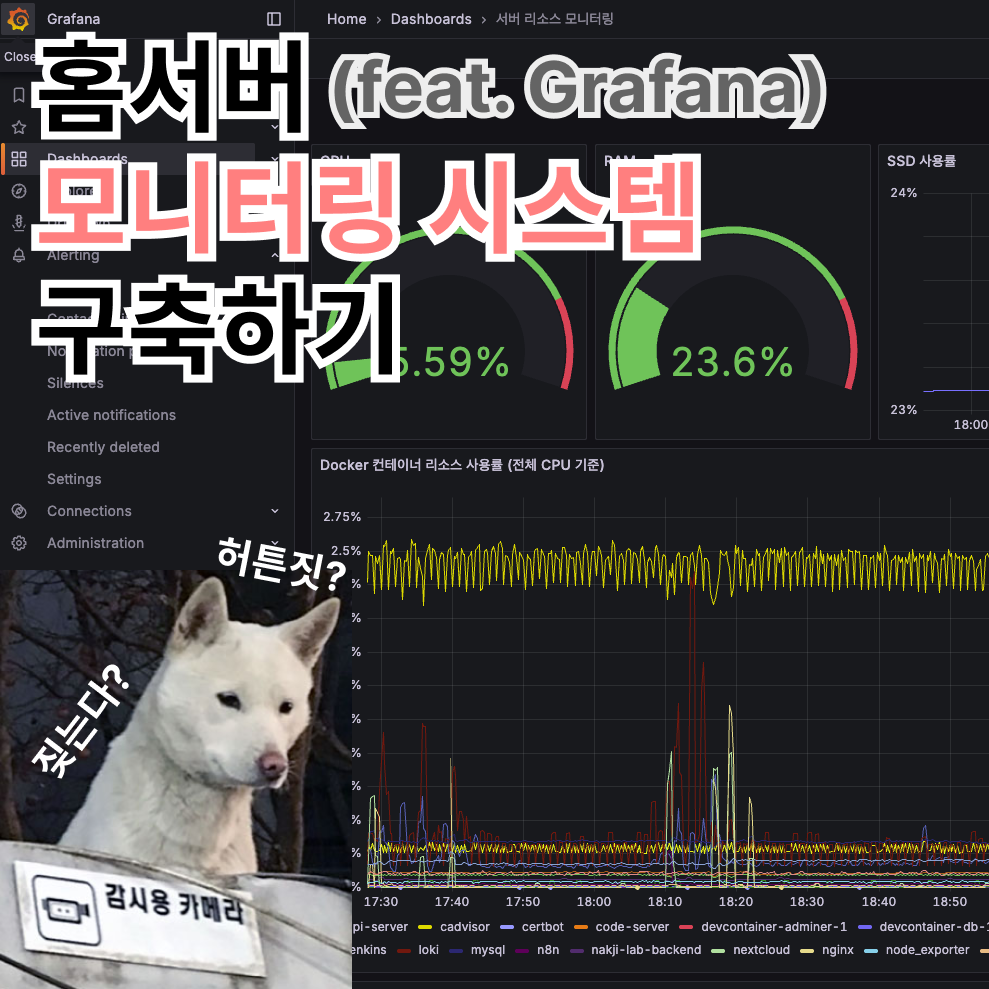
서버의 모든 것을 감시하는 눈, 모니터링 시스템


서버의 모든 것을 관장하는 모니터링 시스템...
그냥 홈서버 만들 때부터 막연히 한번 만들어야하지 하고는 이제서야 만드네
바로 가보자
왜 만들게 되었나?

내가 서버에서 실행하는 것들, 서버에서 동작하는 것들 등등
서버에서 행해지는 모든 것들이 궁금해졌다 (이유 1)
거기에 더해 좀 더 편하게 보고 싶기도 했고...
특히 nginx 로그 보는거 편하게 보고 싶었음 (이유 2)
그도 그럴게 내 서버가 은근 인기가 좋다;; (아직 URL을 어디 홍보한적이 없음에도)
서버에 맨날 그지같은 마음품고 기어들어와선 한대씩 쳐맞고 벤먹은 애들 IP가 벌써 2천개를 넘겼다

서버 보안 글을 쓴게 3개월 전이니 fail2ban 세팅하고 대충 하루에 10개씩 벤했다고 보면 되겠네...
많이도 기어 들어왔다 ㅋㅋㅋ

이 2천개에 육박하는 IP들은 전부 .env를 요구하거나, 어떻게든 치명적인 파일, 정보 한번 빼내보려고 아득바득 달겨드는 악성 유저 & 봇들이다


이 IP들 모두 텍스트 파일로 공유하니 필요하신 분들은 서버에 미리 벤 등록해두시고 시작하셔도 좋을 것 같습니다!
심지어 악의적 요청의 갯수는? 2.7만개 ㅋㅋ

Fail2Ban의 Filter 조건에 해당하는 접근을 6월 10일 기준부터 검색했는데 이토록 많을 줄이야...
어마무시하다 증말;; (나 좀 그만 좋아해;;)
악의적 요청 갯수 세는 스크립트
- 현재 내 Fail2Ban 필터 조건들을 검색 조건에 전부 집어넣어서 걸러지는 것들이 총 몇개나 되는지 세준다!
#!/bin/bash
# Fail2Ban을 적용한 날부터 Ban한 모든 악의적 요청 갯수 세기
# usage: sudo ./count_fail2ban_filter_perl.sh
START="2025-06-10"
END="$(date '+%Y-%m-%d')"   # today
export START_EPOCH=$(date -d "$START 00:00:00" +%s)
export END_EPOCH=$(date -d "$END 23:59:59" +%s)
LOGS="<<Nginx의 access.log 경로>>"

sudo cat $LOGS 2>/dev/null | perl -MTime::Local -ne '
  BEGIN {
    %M = (Jan=>0,Feb=>1,Mar=>2,Apr=>3,May=>4,Jun=>5,Jul=>6,Aug=>7,Sep=>8,Oct=>9,Nov=>10,Dec=>11);
    $s = $ENV{START_EPOCH}+0;
    $e = $ENV{END_EPOCH}+0;
  }
  if (/\[([0-9]{2})\/([A-Za-z]{3})\/([0-9]{4}):([0-9]{2}):([0-9]{2}):([0-9]{2})/) {
    $day = $1; $monname = $2; $year = $3; $hh = $4; $mm = $5; $ss = $6;
    $mon = $M{$monname};
    # timelocal uses localtime; flip order timelocal(sec,min,hour,day,mon,year)
    $ts = timelocal($ss,$mm,$hh,$day,$mon,$year);
    if ($ts >= $s && $ts <= $e) {
      print $_;
    }
  }
' \
  | egrep -i -n -E '(\.git|\.env|\.htaccess|\.htpasswd|/\.aws/credentials|/s3cmd\.ini|\.ini|\.log|\.conf|\.bak|\.old|\.swp|\.save|\.zip|\.sql|\.rar|\.tar\.gz|\.php|\.pl|\.py|\.cgi|\.sh\b|\.bash\b|wp-login\.php|xmlrpc\.php|etc/passwd|druid/index\.html|manager/html|actuator/health|\.vscode|\.idea|phpMyAdmin|myadmin|websql|setup\.php|eval-stdin\.php|cgi-bin/|\\x[0-9A-Fa-f]{2}(\\x[0-9A-Fa-f]{2}){4}|000\.000\.000\.000|\"-\" \"-\"|access forbidden by rule|wget|curl|\\bsh\\b|\\bbash\\b|\\bexec\\b|\\bcmd\\b|/bin/|/usr/bin/|(\.\.|%2e%2e|%2e/|/\.%2e)|boaform|Mozi\.m|/@fs/etc/passwd|device\.rsp)' \
  | wc -l
일정 갯수 쌓이면, Filter에 추가하려고 요즘엔 어떤 패턴으로 정보 빼가려고 하는지 분석하는데 로그 보기가 여간 불편한게 아니다;;;
결국 매번 콘솔창에서 nginx 로그 살펴보고 'grep .env' 같은 키워드 써서 검색하는게 너무 불편해서 모니터링 시스템의 필요성을 느끼고 구현하게 되었다
바로 가보자!!
1. Docker-compose로 구축하기
services:
  # 메트릭 수집
  prometheus:
    image: prom/prometheus:latest
    container_name: prometheus
    volumes:
      - ./prometheus/prometheus.yml:/etc/prometheus/prometheus.yml:ro
    ports:
      - "9090:9090"
    restart: unless-stopped
    networks:
      - monitoring_network

  # 시각화
  grafana:
    image: grafana/grafana:latest
    container_name: grafana
    user: "${UID}:${GID}"
    volumes:
      - ./grafana:/var/lib/grafana
    ports:
      - "3000:3000"
    restart: unless-stopped
    networks:
      - monitoring_network

  # Nginx 로그 등 모든 로그를 수집 및 저장을 담당
  loki:
    image: grafana/loki:2.9.0
    container_name: loki
    user: "10001:10001"
    volumes:
      - ./loki/config.yml:/etc/loki/config.yml
      - ./loki/data:/loki
    command: -config.file=/etc/loki/config.yml
    ports:
      - "3100:3100"
    restart: unless-stopped
    networks:
      - monitoring_network

  # Nginx 로그 수집, Loki에게 전달
  promtail:
    image: grafana/promtail:2.9.0
    container_name: promtail
    volumes:
      - ./promtail/config.yml:/etc/promtail/config.yml
      - <nginx 로그 위치>/nginx/log:/var/log/nginx:ro
    command: -config.file=/etc/promtail/config.yml
    restart: unless-stopped
    networks:
      - monitoring_network

  # 호스트 자원(CPU, RAM, 디스크, 네트워크) 수집
  node_exporter:
    image: prom/node-exporter:latest
    container_name: node_exporter
    restart: unless-stopped
    networks:
      - monitoring_network

  # 컨테이너 자원 모니터링
  cadvisor:
    image: gcr.io/cadvisor/cadvisor:latest
    container_name: cadvisor
    volumes:
      - /:/rootfs:ro
      - /var/run:/var/run:rw
      - /sys:/sys:ro
      - /var/lib/docker/:/var/lib/docker:ro
      - /var/lib/containerd/:/var/lib/containerd:ro
    ports:
      - "8081:8080"
    restart: unless-stopped
    networks:
      - monitoring_network

networks:
  app_network:
    external: true
  monitoring_network:
    external: true
몇가지 설명하면
- 각 컨테이너들의 기능은 아래와 같다 (한줄요약 ver)
| 컨테이너 이름 | 역할 |
| prometheus | 메트릭 데이터 수집 및 저장 |
| grafana | 시각화 |
| loki | Nginx 로그 저장 |
| promtail | Nginx 로그 수집 -> Loki 전달 |
| node_exporter | 호스트 자원(CPU, RAM, 디스크, 네트워크) 수집 |
| cadvisor | 컨테이너 자원 모니터링 |
- 내 서버의 nginx 로그는 바인드 마운트 되어있다
- 로컬에 access.log랑 error.log가 있으니까 해당 디렉토리를 직접 promtail에 연결해줬다
2. 컨테이너 세팅
- 좀 귀찮지만 모니터링 시스템은 각 컨테이너 별로 설정 파일을 만들어줘야 한다
- 디렉토리를 트리 구조로 보면 아래와 같음
[모니터링 시스템 디렉토리]
├── docker-compose.yml
├── grafana
├── loki
│   ├── config.yml
│   └── data
├── prometheus
│   └── prometheus.yml
└── promtail
    └── config.yml
1) ./prometheus/prometheus.yml
- 간단히 설명하면
(1) 15초마다 한번씩 가져올거고,
(2) 가져오는 대상들은 job_name으로 할당한다
- 프로메테우스가 자기자신을 조회하는건 일종의 헬스체크다
global:
  scrape_interval: 15s

scrape_configs:
  - job_name: "prometheus"
    static_configs:
      - targets: ["prometheus:9090"]

  - job_name: "node_exporter"
    static_configs:
      - targets: ["host.docker.internal:9100"]

  - job_name: "cadvisor"
    static_configs:
      - targets: ["cadvisor:8080"]
2) ./loki/config.yml
한줄 요약 : Loki가 인증 없이 3100 포트에서 실행되며, 로그를 로컬에 저장하고, 인덱스는 하루 단위로 관리하며, 7일 이상 지난 로그는 거부!
auth_enabled: false

server:
  http_listen_port: 3100

ingester:
  lifecycler:
    address: 127.0.0.1
    ring:
      kvstore:
        store: inmemory
      replication_factor: 1
  chunk_idle_period: 5m
  max_chunk_age: 1h

schema_config:
  configs:
    - from: 2020-10-24
      store: boltdb-shipper
      object_store: filesystem
      schema: v11
      index:
        prefix: index_
        period: 24h

storage_config:
  boltdb_shipper:
    active_index_directory: /loki/index
    cache_location: /loki/cache
    shared_store: filesystem
  filesystem:
    directory: /loki/chunks

limits_config:
  enforce_metric_name: false
  reject_old_samples: true
  reject_old_samples_max_age: 168h
3) ./promtail/config.yml
- promtail은 재밌게도 자기가 어디까지 읽었는지 기록하는 파일이 있다 (positions 옵션의 /tmp/positions.yaml)
server:
  http_listen_port: 9080
  grpc_listen_port: 0

positions:
  filename: /tmp/positions.yaml

clients:
  - url: http://loki:3100/loki/api/v1/push

scrape_configs:
  - job_name: nginx
    static_configs:
      - targets:
          - localhost
        labels:
          job: nginx
          __path__: /var/log/nginx/*.log
3. 컨테이너 띄우고 접속하기
- 모니터링 시스템에선 죄다 미리 연결해놓고 시작해서 'docker compose up -d' 하면 끝!
- 다만 연결할 때 이슈가 하나 있었는데...이건 번외에서
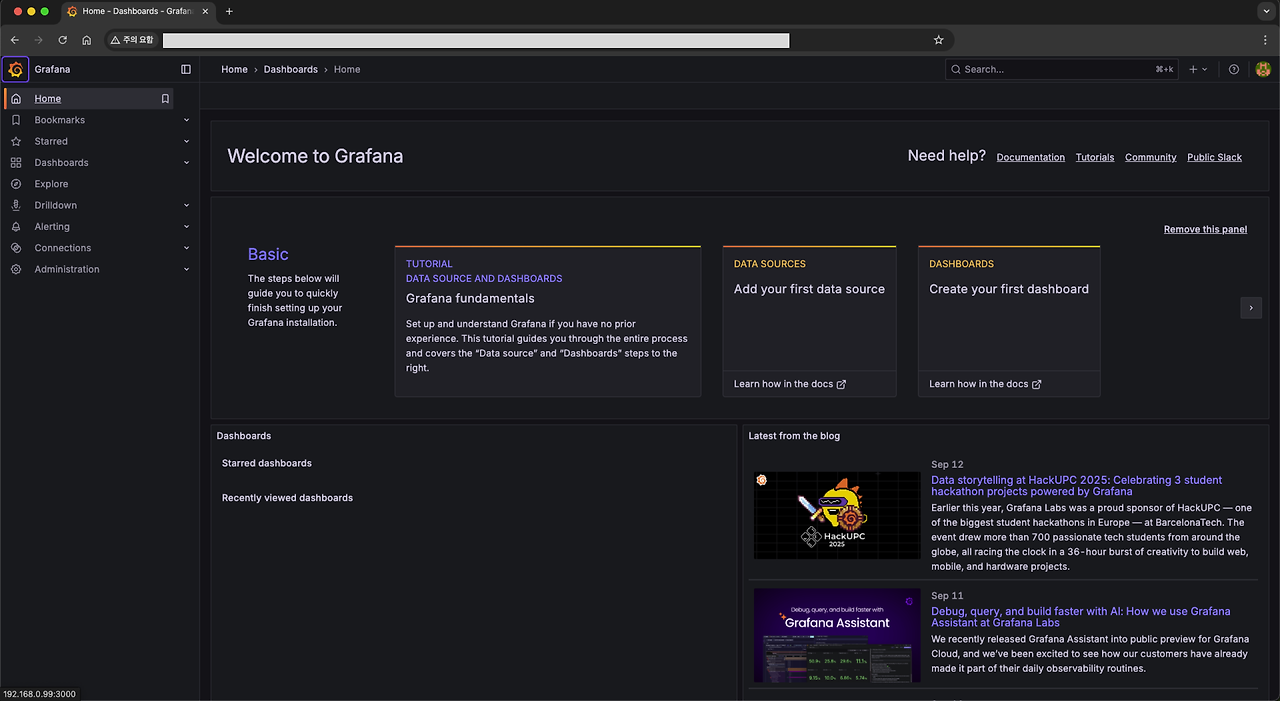
접속하기
- 크롬 주소창에 <서버 내부망 IP>:<그라파나 포트번호> 입력하면 된다 (e.g. 192.168.0.1:3000)
- 그러면 짜그라진 그라파나 몇번 튀어오르더니? 사이트 뿅!

- 초기 세팅은 admin, admin이니까 로긴하고 들어가서 ID, PW 다 바꿔야한다

- 다됐다! 이제 대시보드를 만들어보자!!
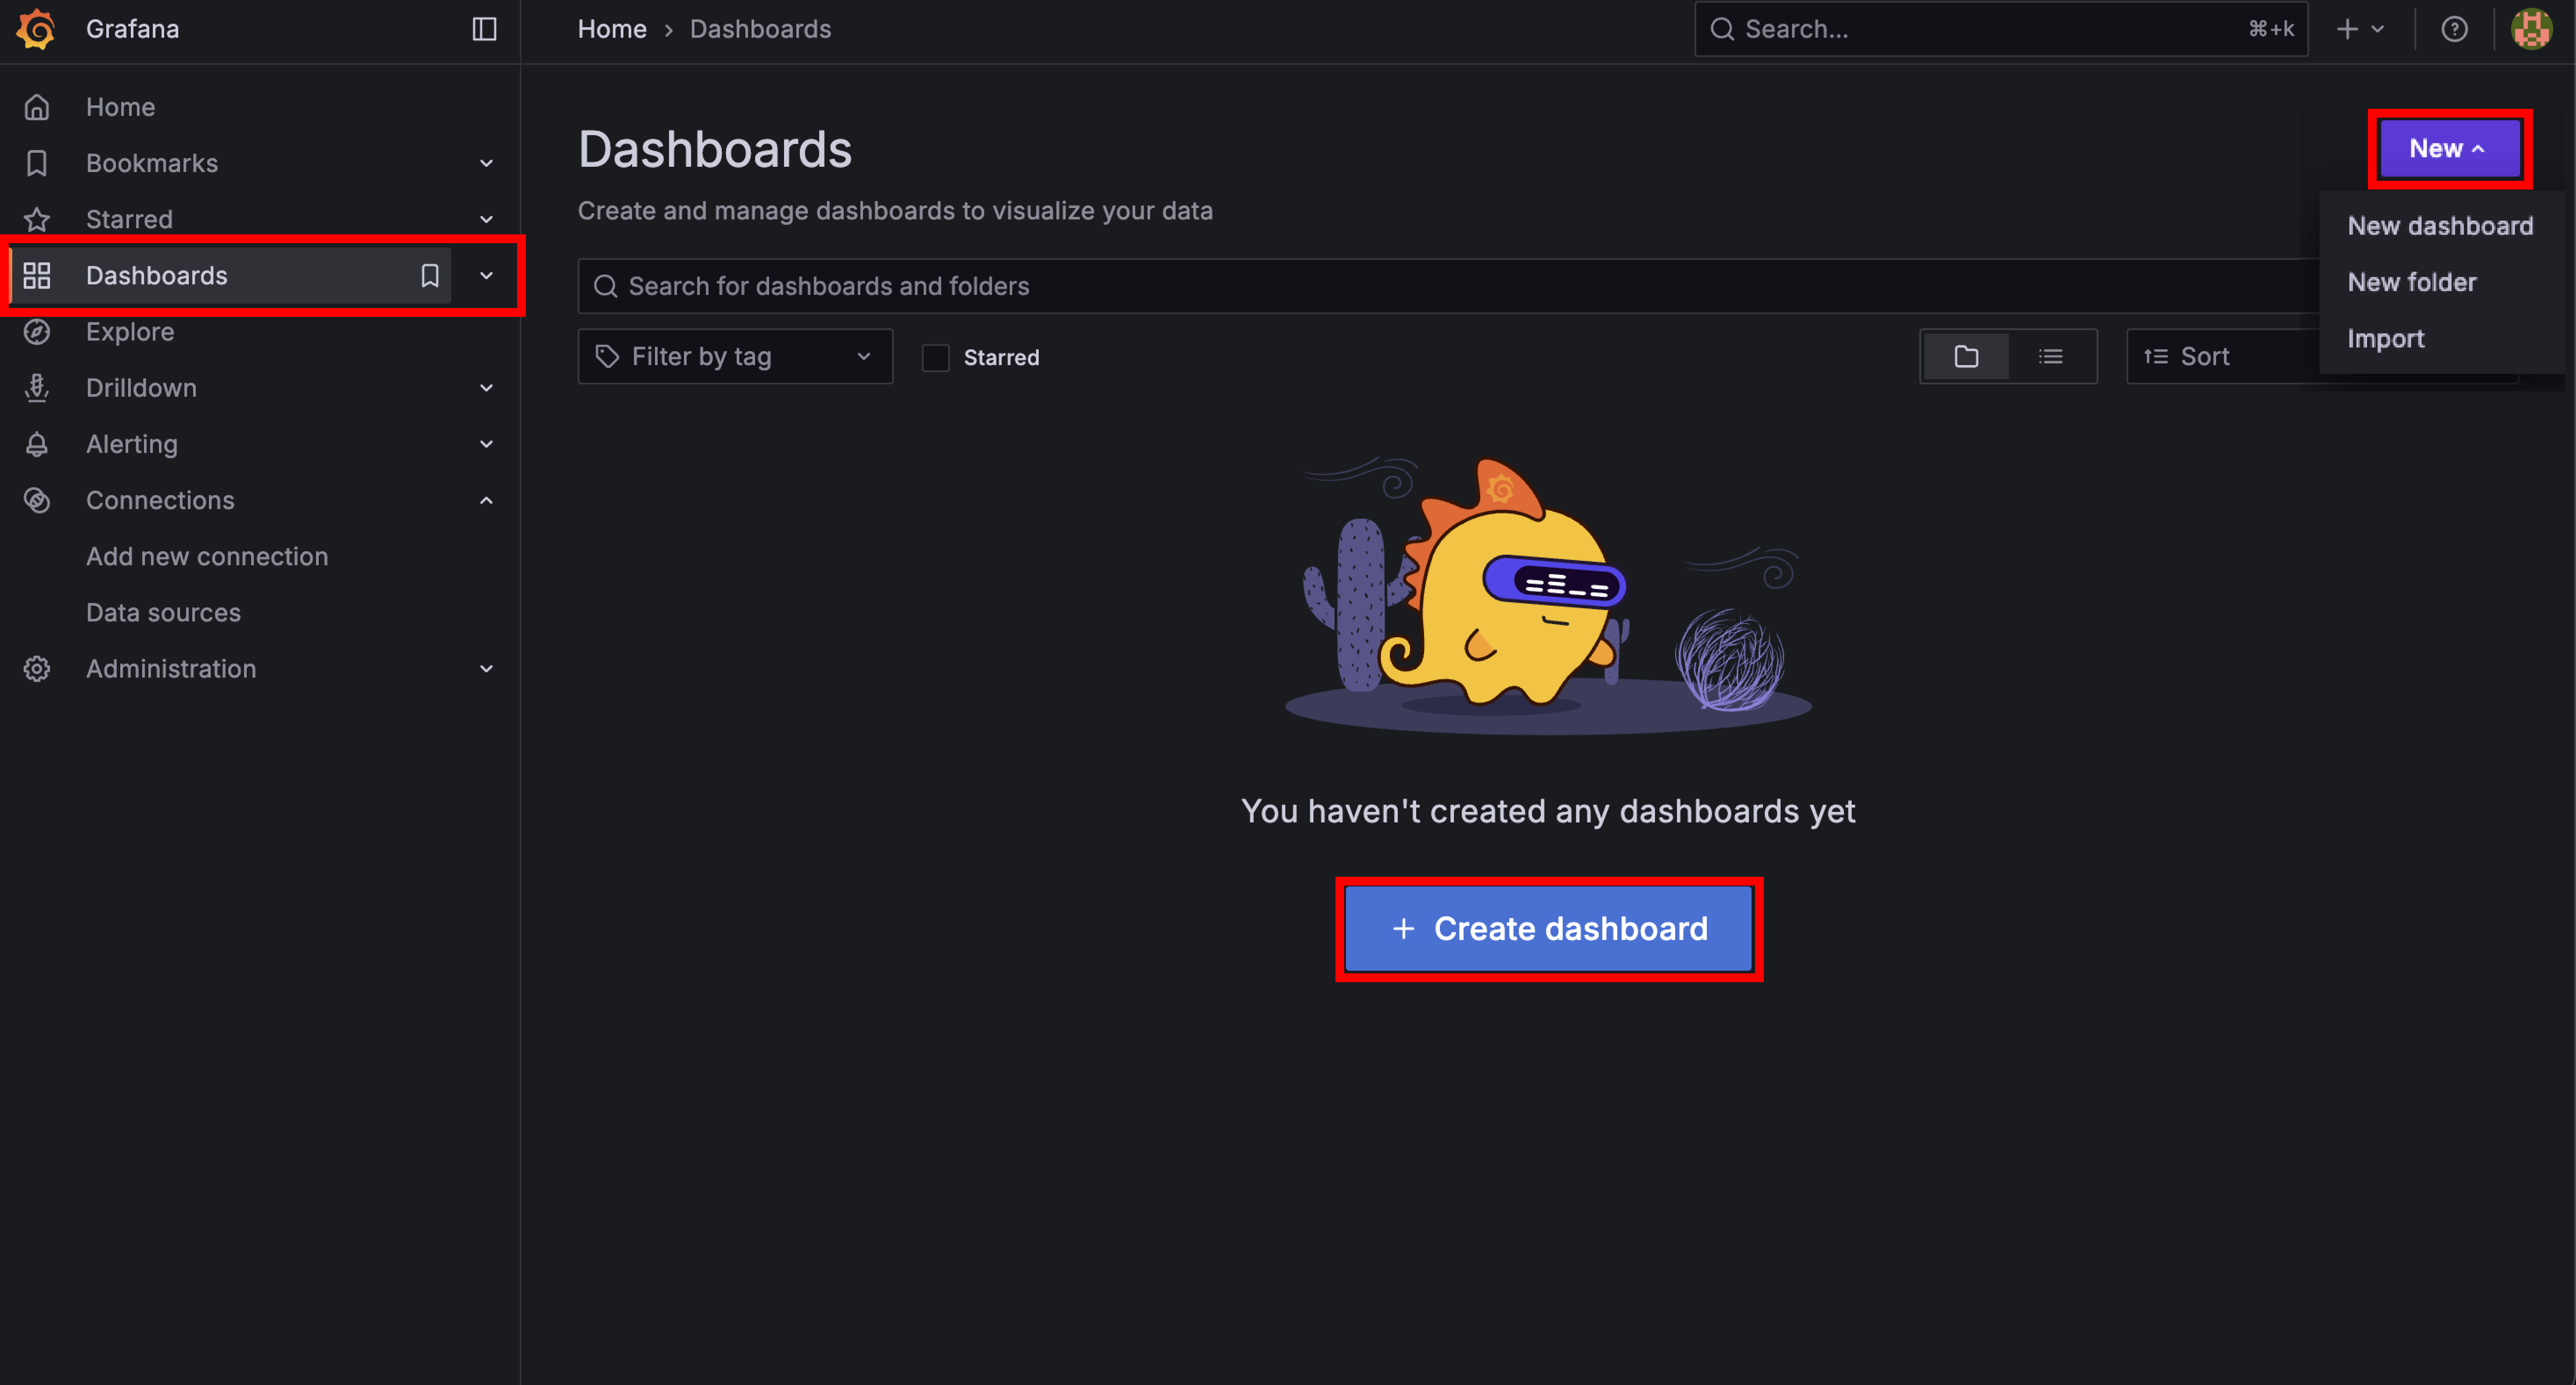
4. Grafana에 대시보드 만들기
(1) 일단 대시보드 생성 선택
(2) 데이터셋 선택
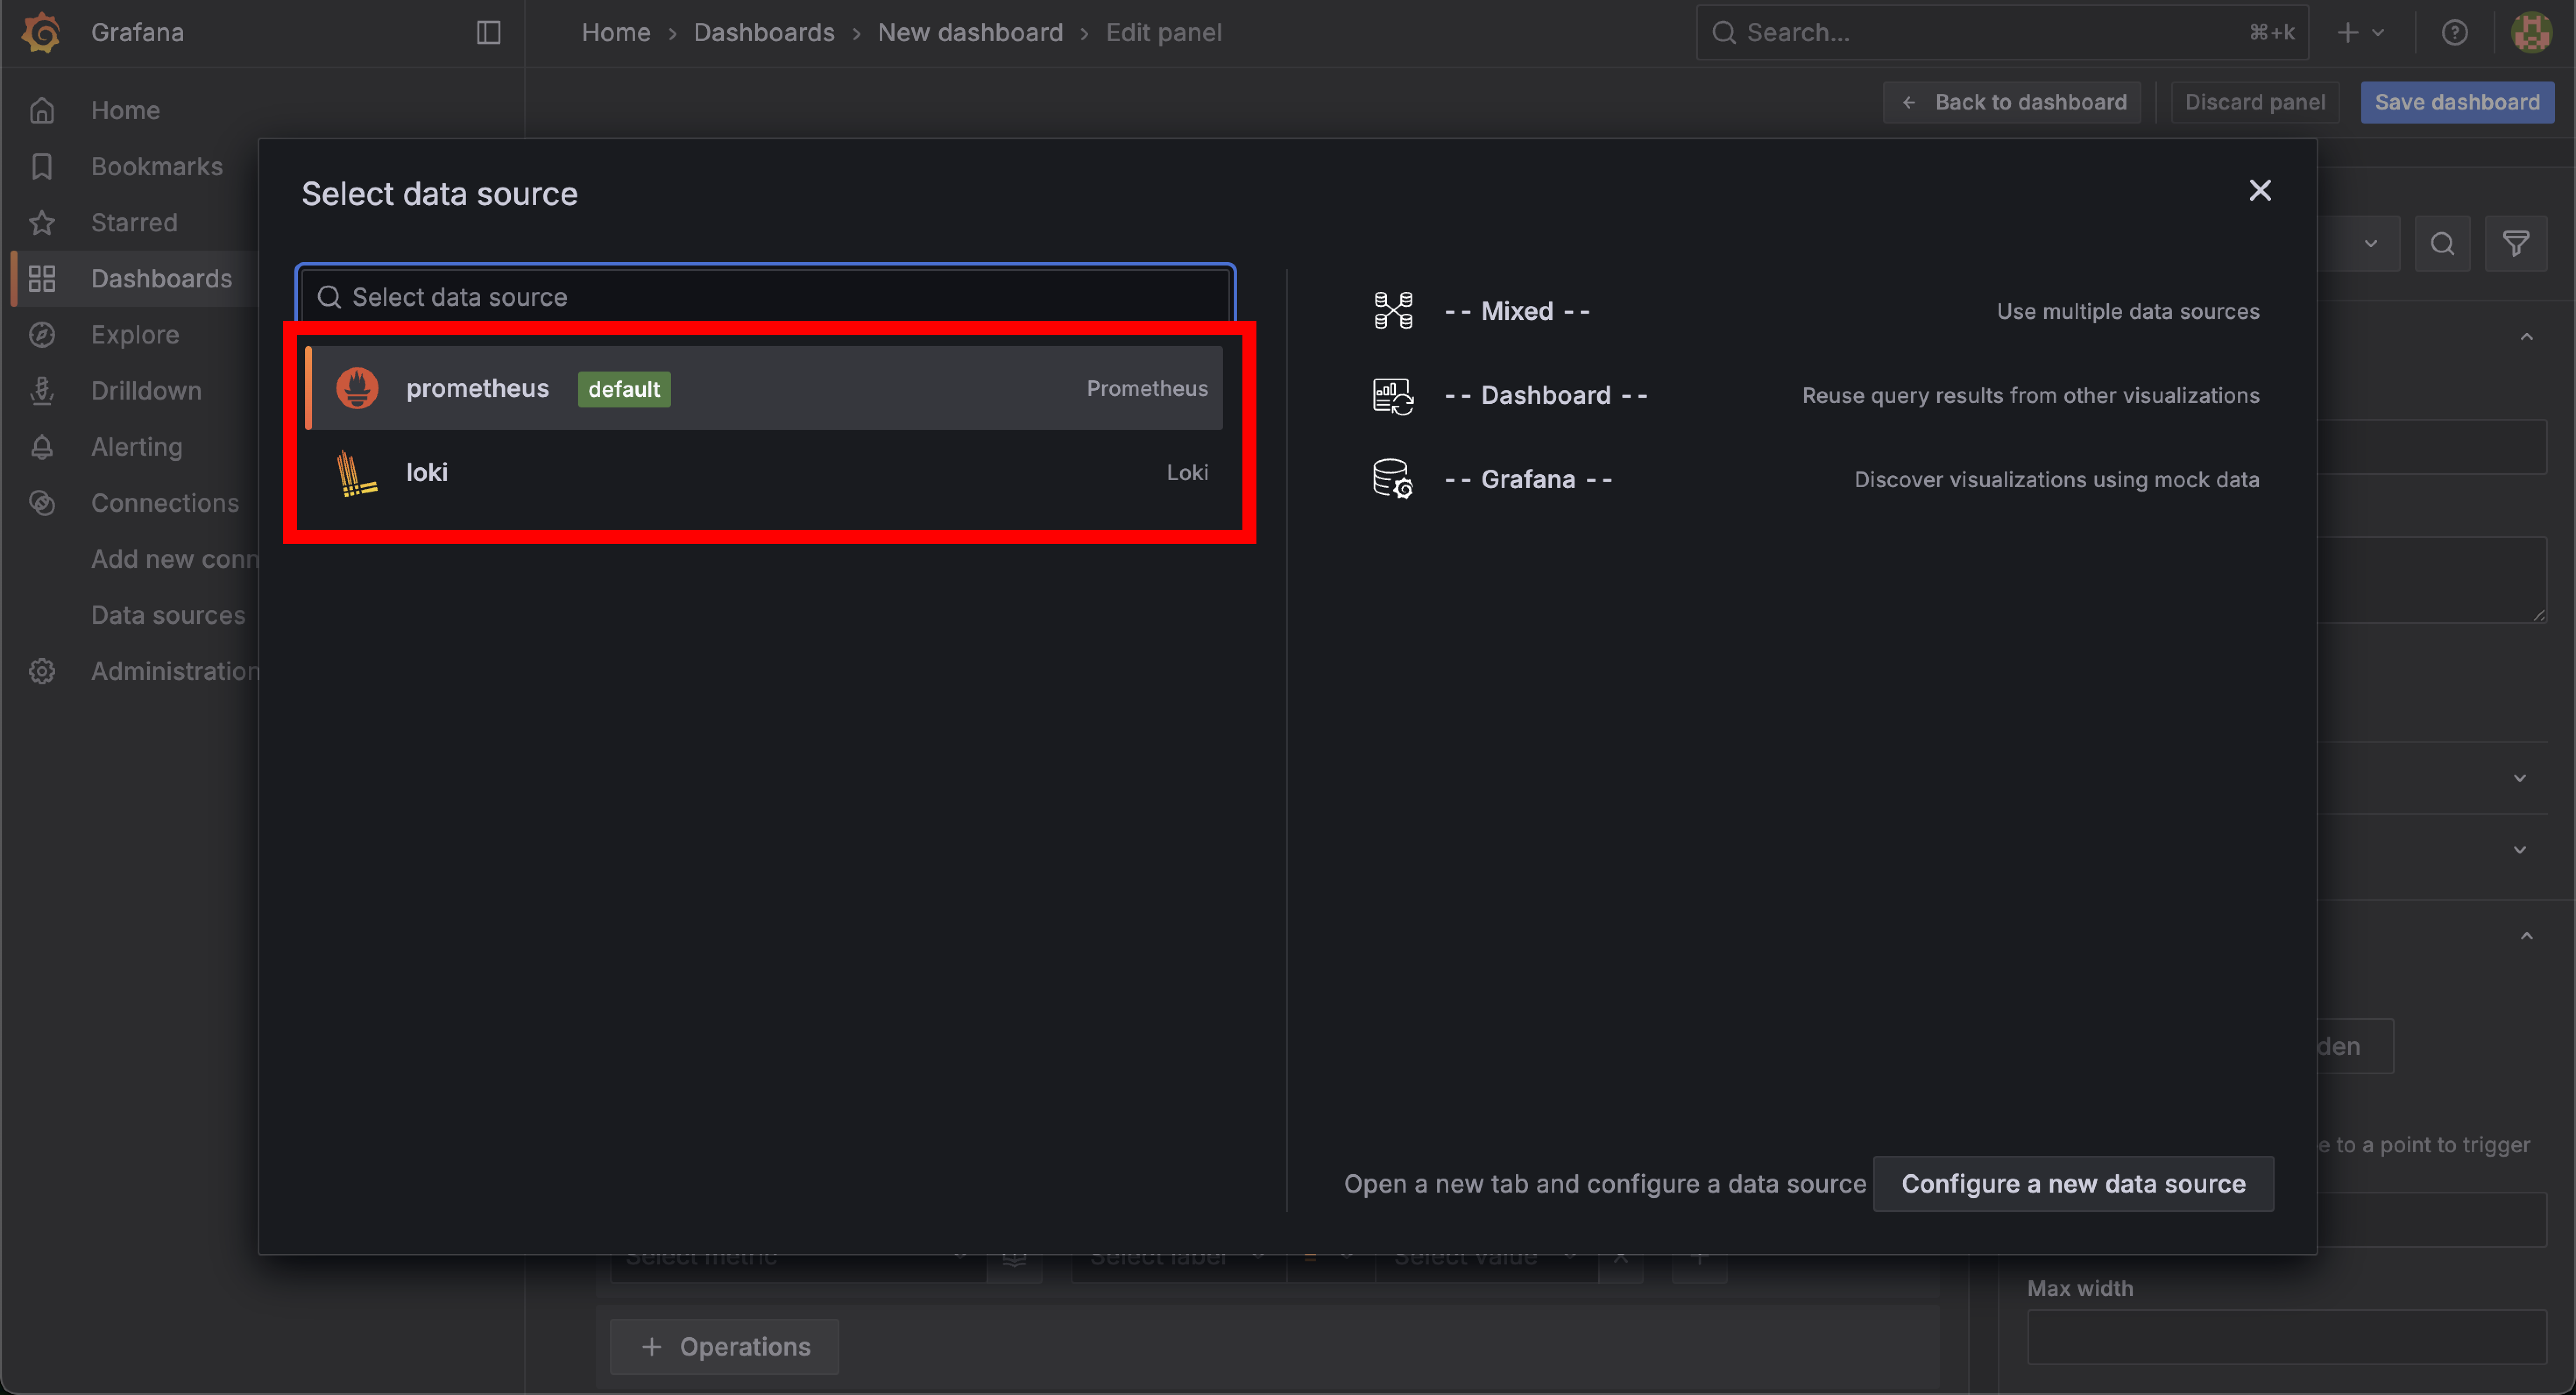
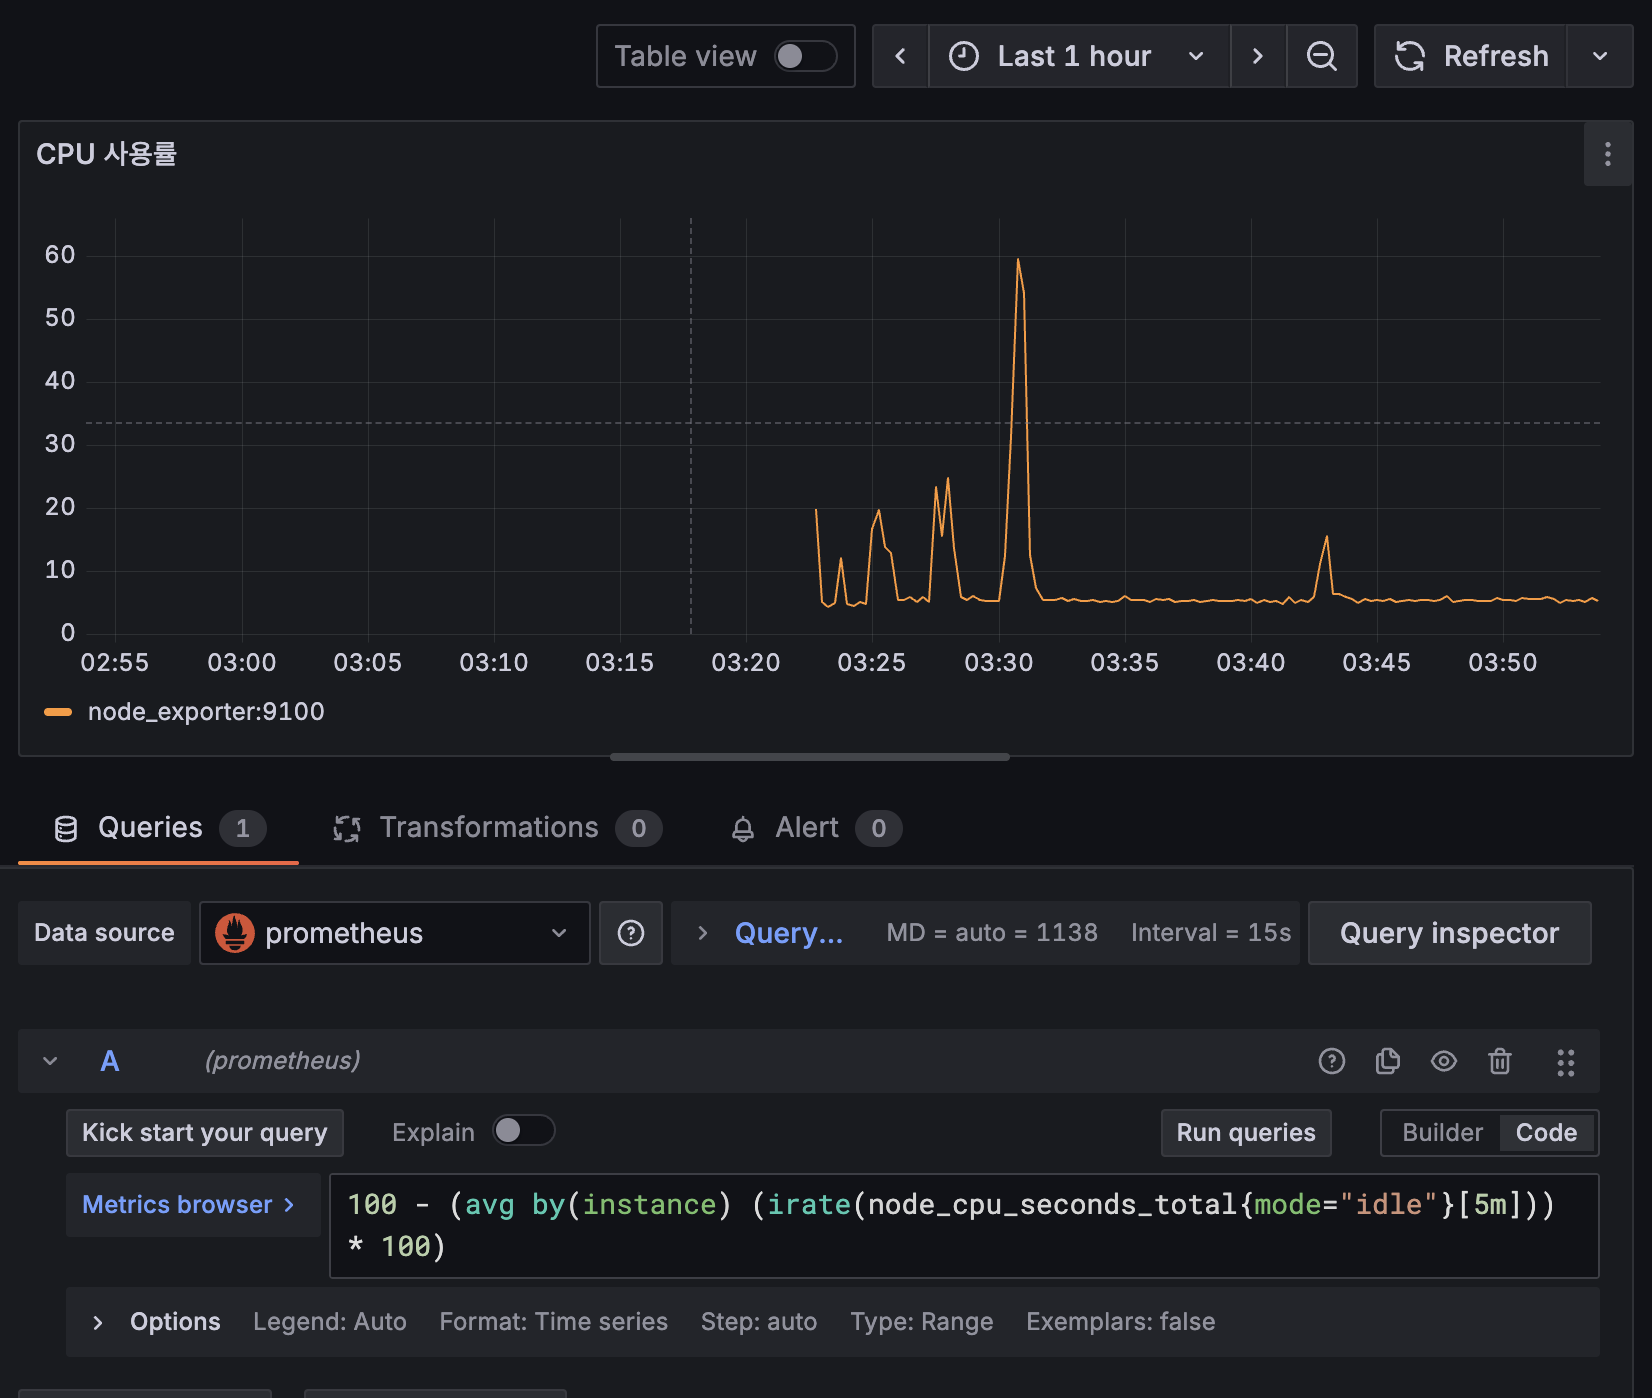
(3) 쿼리문 적어넣기

- 적어넣은 쿼리문 + 시간 범위에 따라 그래프 형태가 표기된다 (그래프 형태도 바꿀 수 있음)
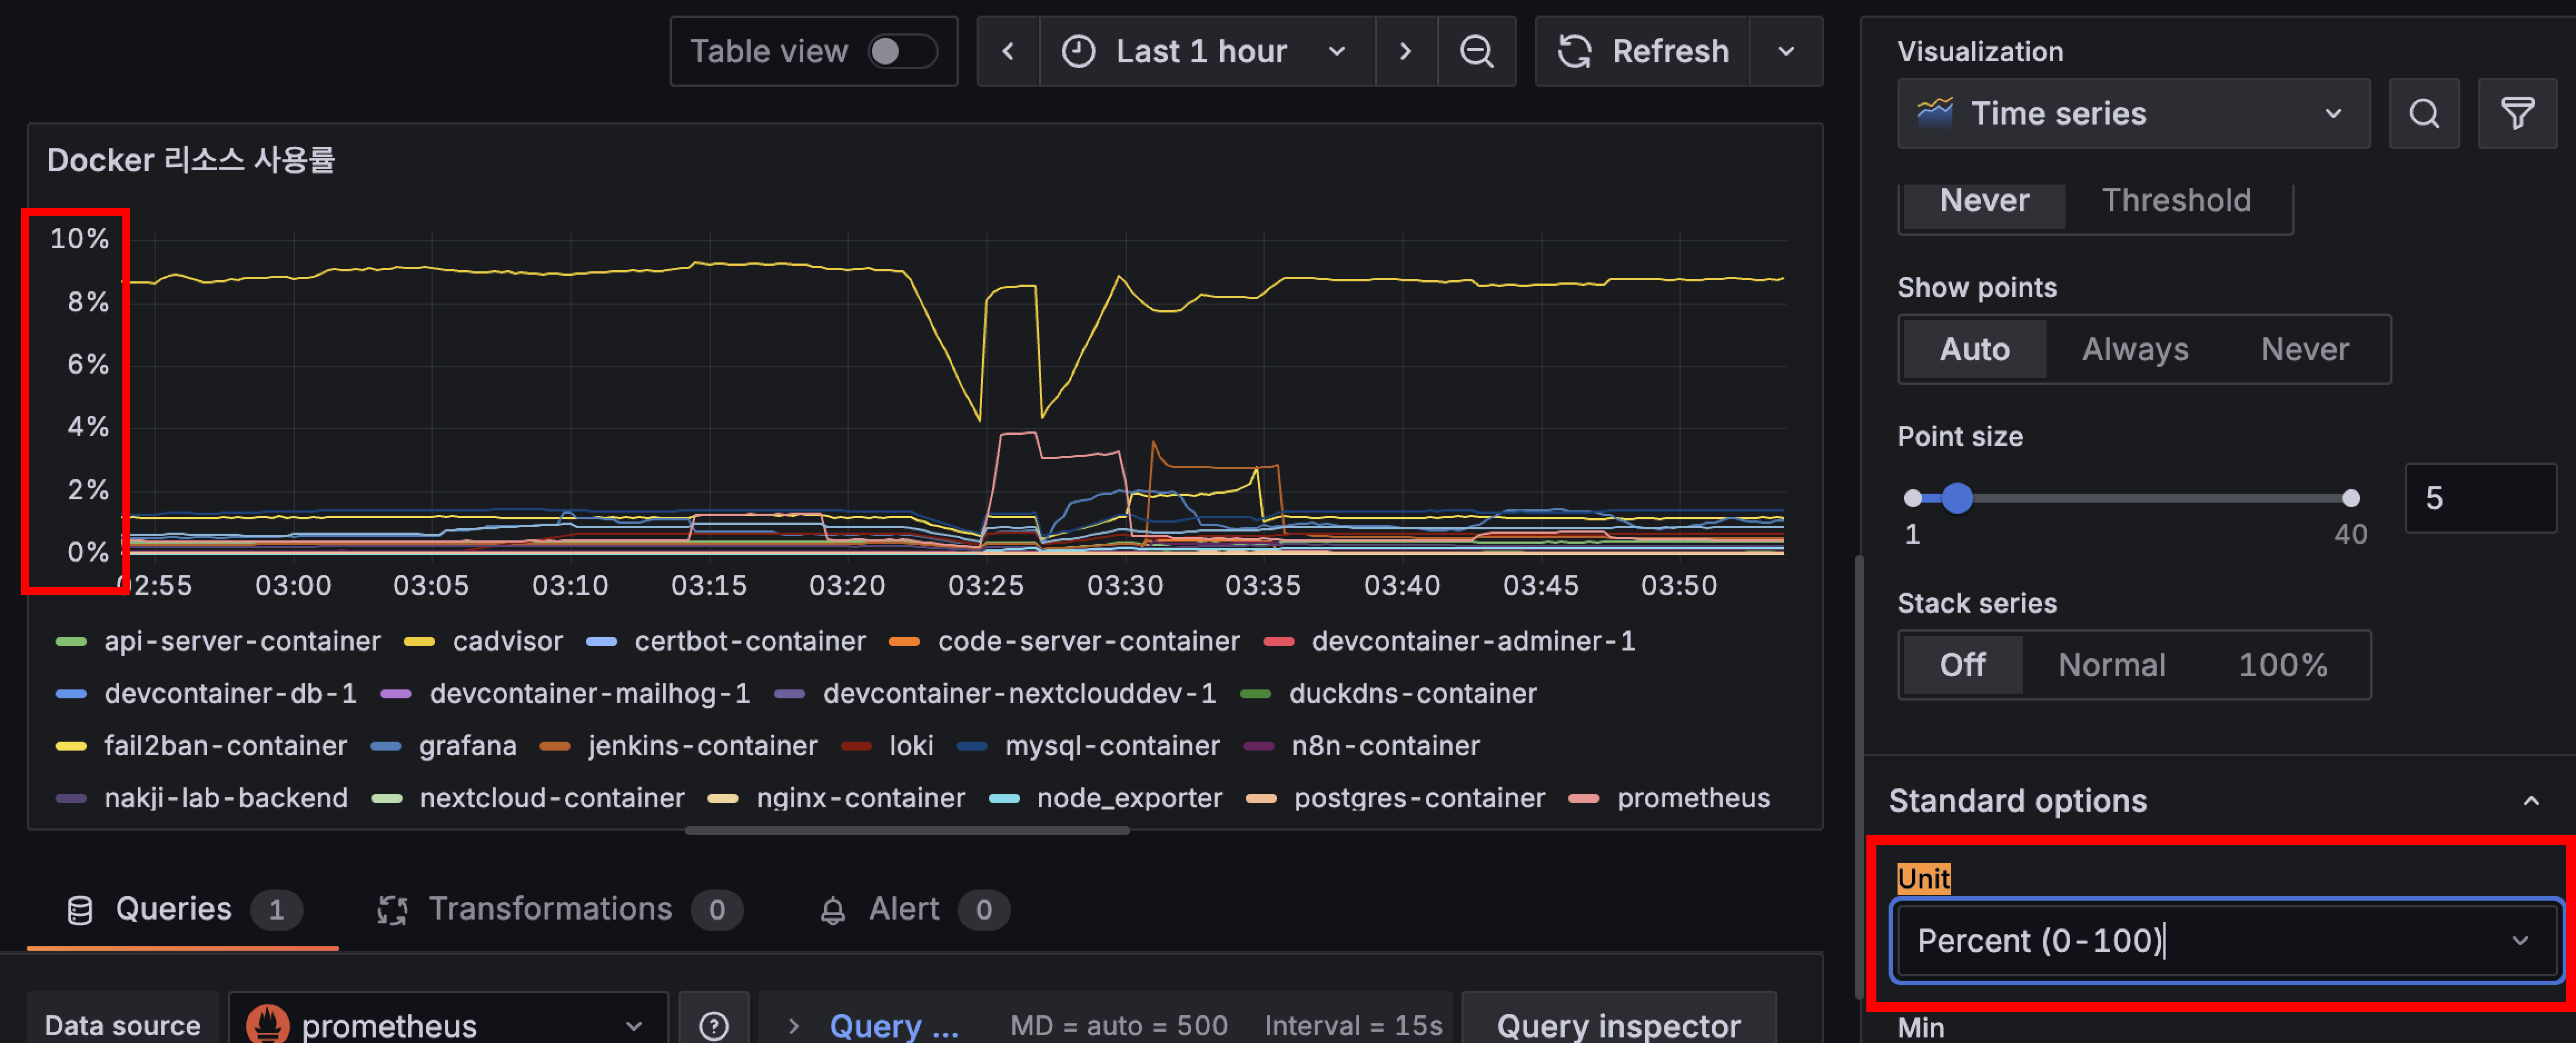
- y축에 단위 표기 방법 (Standard options - Unit)
- 소숫점 처리 방법

5. 대시보드에 서버 모니터링 구축하기
아래는 내가 현재 쓰고 있는 쿼리문이다
다만 네트워크 쿼리문은 문제가 좀 있는데 아직 해결을 못함 ㅠ
번외에 적어두었고, 추후에 해결할 예정
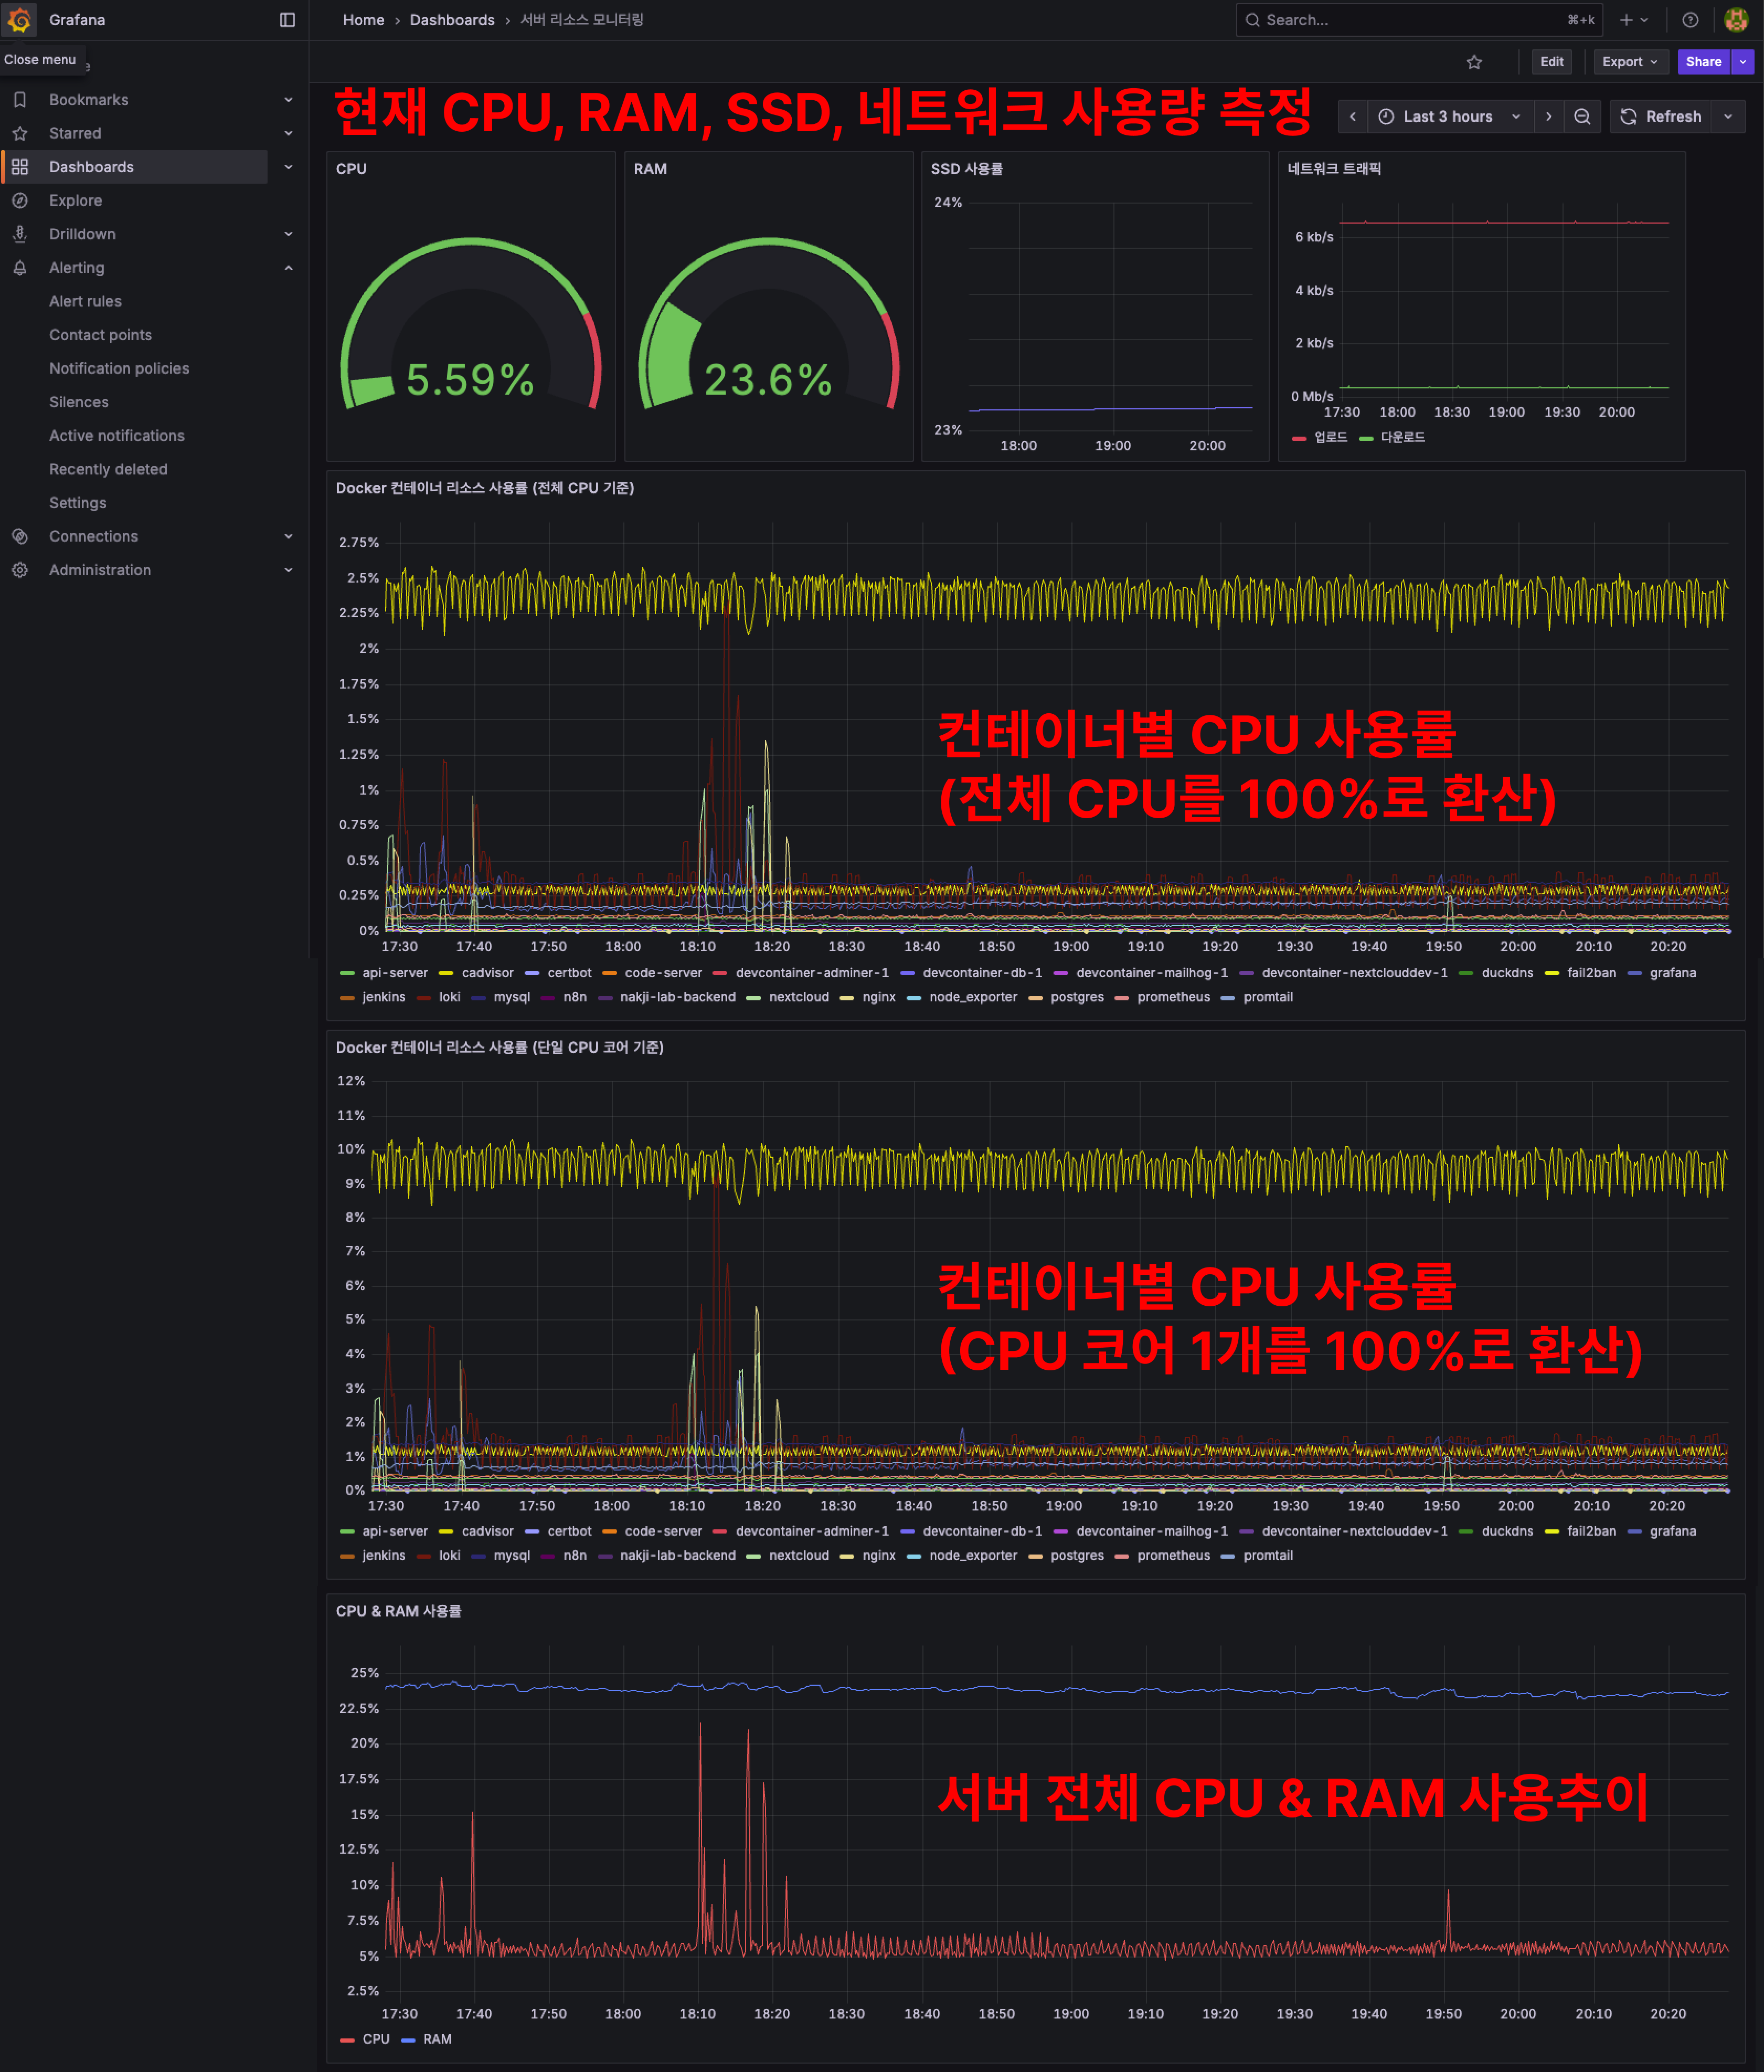
(1) CPU & RAM & SSD & 네트워크
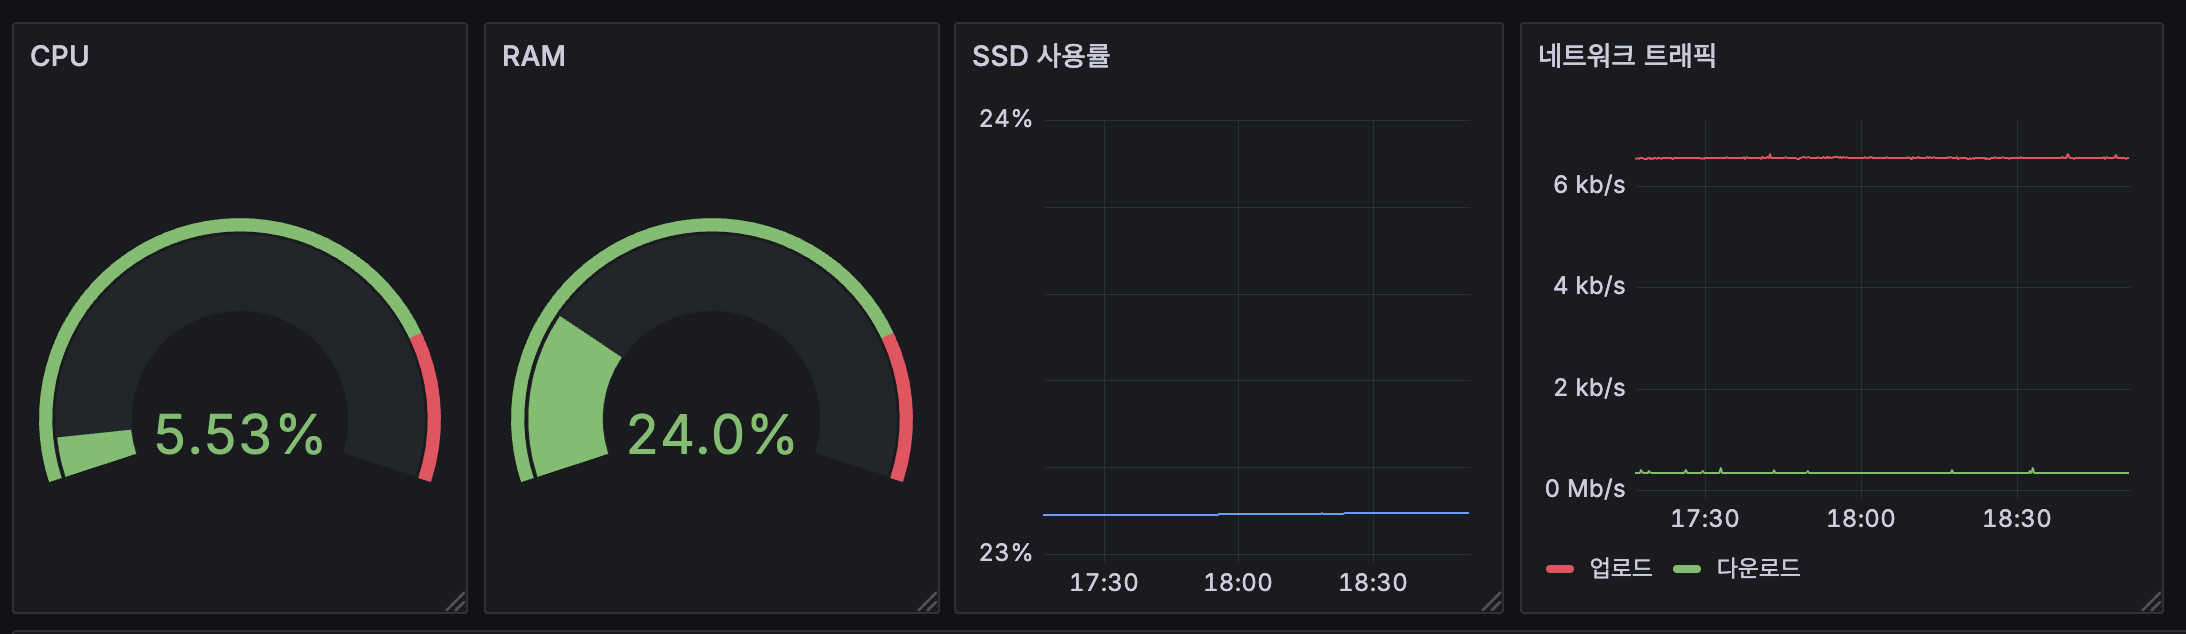
# CPU
100 - (avg(rate(node_cpu_seconds_total{mode="idle"}[5m])) * 100)
# RAM
(1 - (node_memory_MemAvailable_bytes / node_memory_MemTotal_bytes)) * 100
# SSD (device 이름은 각자의 환경마다 다를 수 있으니 확인해줘야 함)
100 - ((node_filesystem_avail_bytes{device="/dev/nvme0n1p2",mountpoint="/etc/hostname"} / node_filesystem_size_bytes{device="/dev/nvme0n1p2",mountpoint="/etc/hostname"}) * 100)
# 네트워크 - 업로드
sum(irate(node_network_transmit_bytes_total{device=~"eth0"}[30s])) * 8 / 1000000
# 네트워크 - 다운로드
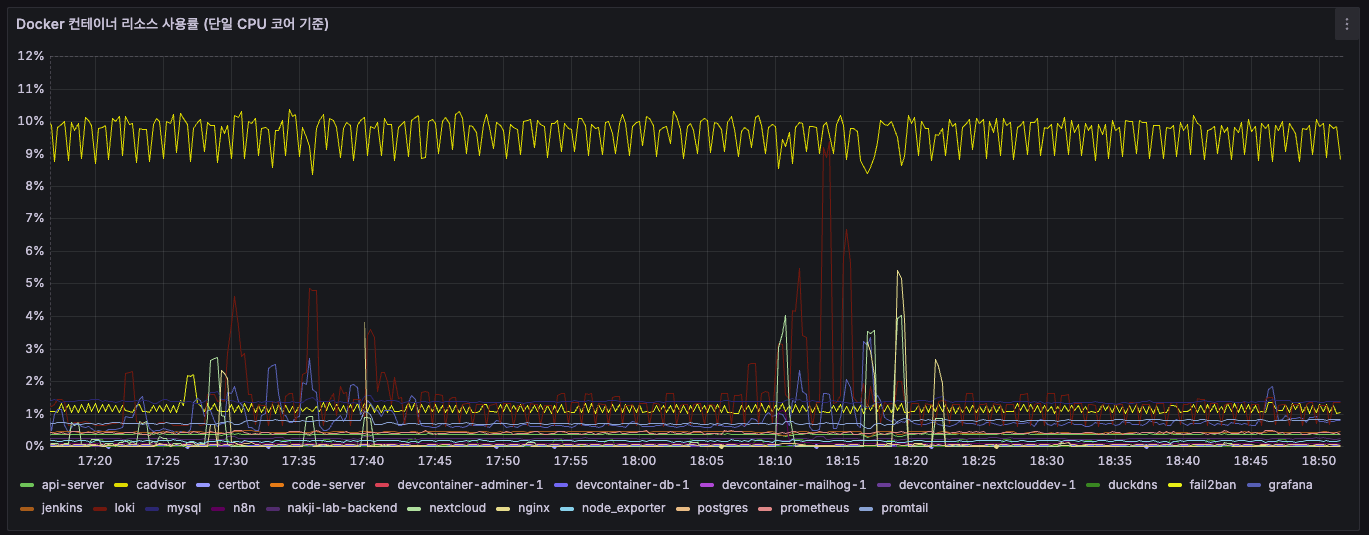
sum(irate(node_network_receive_bytes_total{device=~"eth0"}[30s])) * 8 / 1000000(2) 컨테이너별 리소스 사용률

# Docker 컨테이너 리소스 사용률 (전체 CPU 기준)
sum(rate(container_cpu_usage_seconds_total{image!=''}[$__rate_interval])) by (name) / on() group_left() count(node_cpu_seconds_total{mode='system'}) * 100

# Docker 컨테이너 리소스 사용률 (단일 CPU 코어 기준)
sum(rate(container_cpu_usage_seconds_total{image!=''}[$__rate_interval])) by (name) * 100
(3) nginx 로그 갯수

count_over_time({filename="/var/log/nginx/access.log", job="nginx"}[5m])6. 실제로 Prometheus가 데이터를 수집하는 모습
아래 명령어를 실행해보면 Prometheus가 다른 exporter들에게 데이터를 주기적으로 가져옴을 확인할 수 있다
이 때 주기는 내가 아까 설정한 prometheus.yml의 scrape_interval이다
# 포트번호를 9100으로 설정한 이유는 node_exporter의 포트를 저것으로 설정했기 때문!
sudo tcpdump -i any port 9100
번외
1. Grafana 컨테이너 권한 이슈
이 것은 그라파나(docker-compose.yml)에 user: "${UID}:${GID}" 추가한 이유와도 일맥 상통한다
아래와 같은 에러 발생

에러 전문
n100@n100-Beelink:~/$ docker logs -f grafana
GF_PATHS_DATA='/var/lib/grafana' is not writable.
You may have issues with file permissions, more information here: http://docs.grafana.org/installation/docker/#migrate-to-v51-or-later
mkdir: can't create directory '/var/lib/grafana/plugins': Permission denied
GF_PATHS_DATA='/var/lib/grafana' is not writable.
You may have issues with file permissions, more information here: http://docs.grafana.org/installation/docker/#migrate-to-v51-or-later
mkdir: can't create directory '/var/lib/grafana/plugins': Permission denied
GF_PATHS_DATA='/var/lib/grafana' is not writable.
You may have issues with file permissions, more information here: http://docs.grafana.org/installation/docker/#migrate-to-v51-or-later
mkdir: can't create directory '/var/lib/grafana/plugins': Permission denied
GF_PATHS_DATA='/var/lib/grafana' is not writable.
You may have issues with file permissions, more information here: http://docs.grafana.org/installation/docker/#migrate-to-v51-or-later
mkdir: can't create directory '/var/lib/grafana/plugins': Permission denied
GF_PATHS_DATA='/var/lib/grafana' is not writable.
You may have issues with file permissions, more information here: http://docs.grafana.org/installation/docker/#migrate-to-v51-or-later
mkdir: can't create directory '/var/lib/grafana/plugins': Permission denied
GF_PATHS_DATA='/var/lib/grafana' is not writable.
You may have issues with file permissions, more information here: http://docs.grafana.org/installation/docker/#migrate-to-v51-or-later
mkdir: can't create directory '/var/lib/grafana/plugins': Permission denied
GF_PATHS_DATA='/var/lib/grafana' is not writable.
You may have issues with file permissions, more information here: http://docs.grafana.org/installation/docker/#migrate-to-v51-or-later
mkdir: can't create directory '/var/lib/grafana/plugins': Permission denied
GF_PATHS_DATA='/var/lib/grafana' is not writable.
You may have issues with file permissions, more information here: http://docs.grafana.org/installation/docker/#migrate-to-v51-or-later
mkdir: can't create directory '/var/lib/grafana/plugins': Permission denied
처음엔 그냥 이전 nextcloud 때처럼 root 권한이 아니라서 그런가보다 하고 root 권한 줬음
또 안됨;;
확인해보니 root 권한이라서 이런 문제가 생겼던...
그래서 서버의 일반 사용자 권한으로 세팅해줬다
n100@n100-Beelink:~$ ls -ld ./grafana
drwxr-xr-x 2 root root 4096  9월 13 01:52 ./grafana
n100@n100-Beelink:~$ sudo chown -R 1000:1000 ./grafana
n100@n100-Beelink:~$ ls -ld ./grafana
drwxr-xr-x 2 n100 n100 4096  9월 13 01:52 ./grafana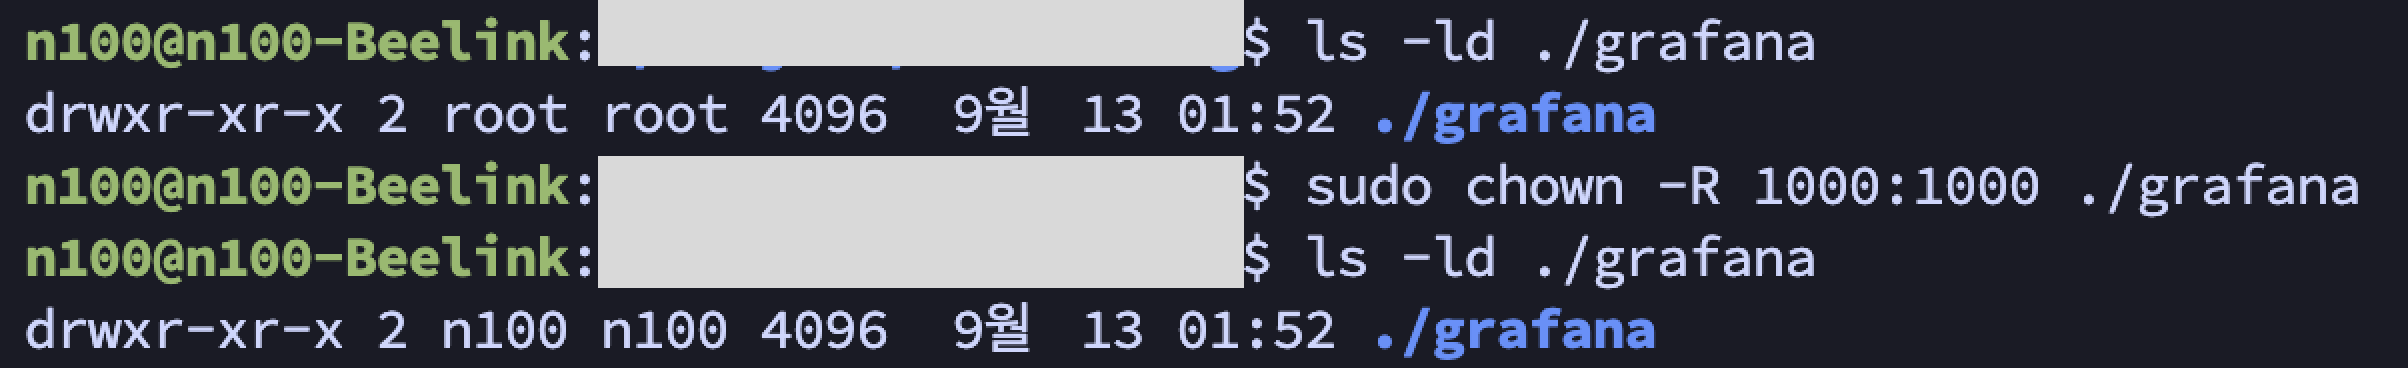
해결하고 나선 곧잘됨~

2. Grafana - Loki 없음 이슈
- Data Sources - Add data source - Loki 검색
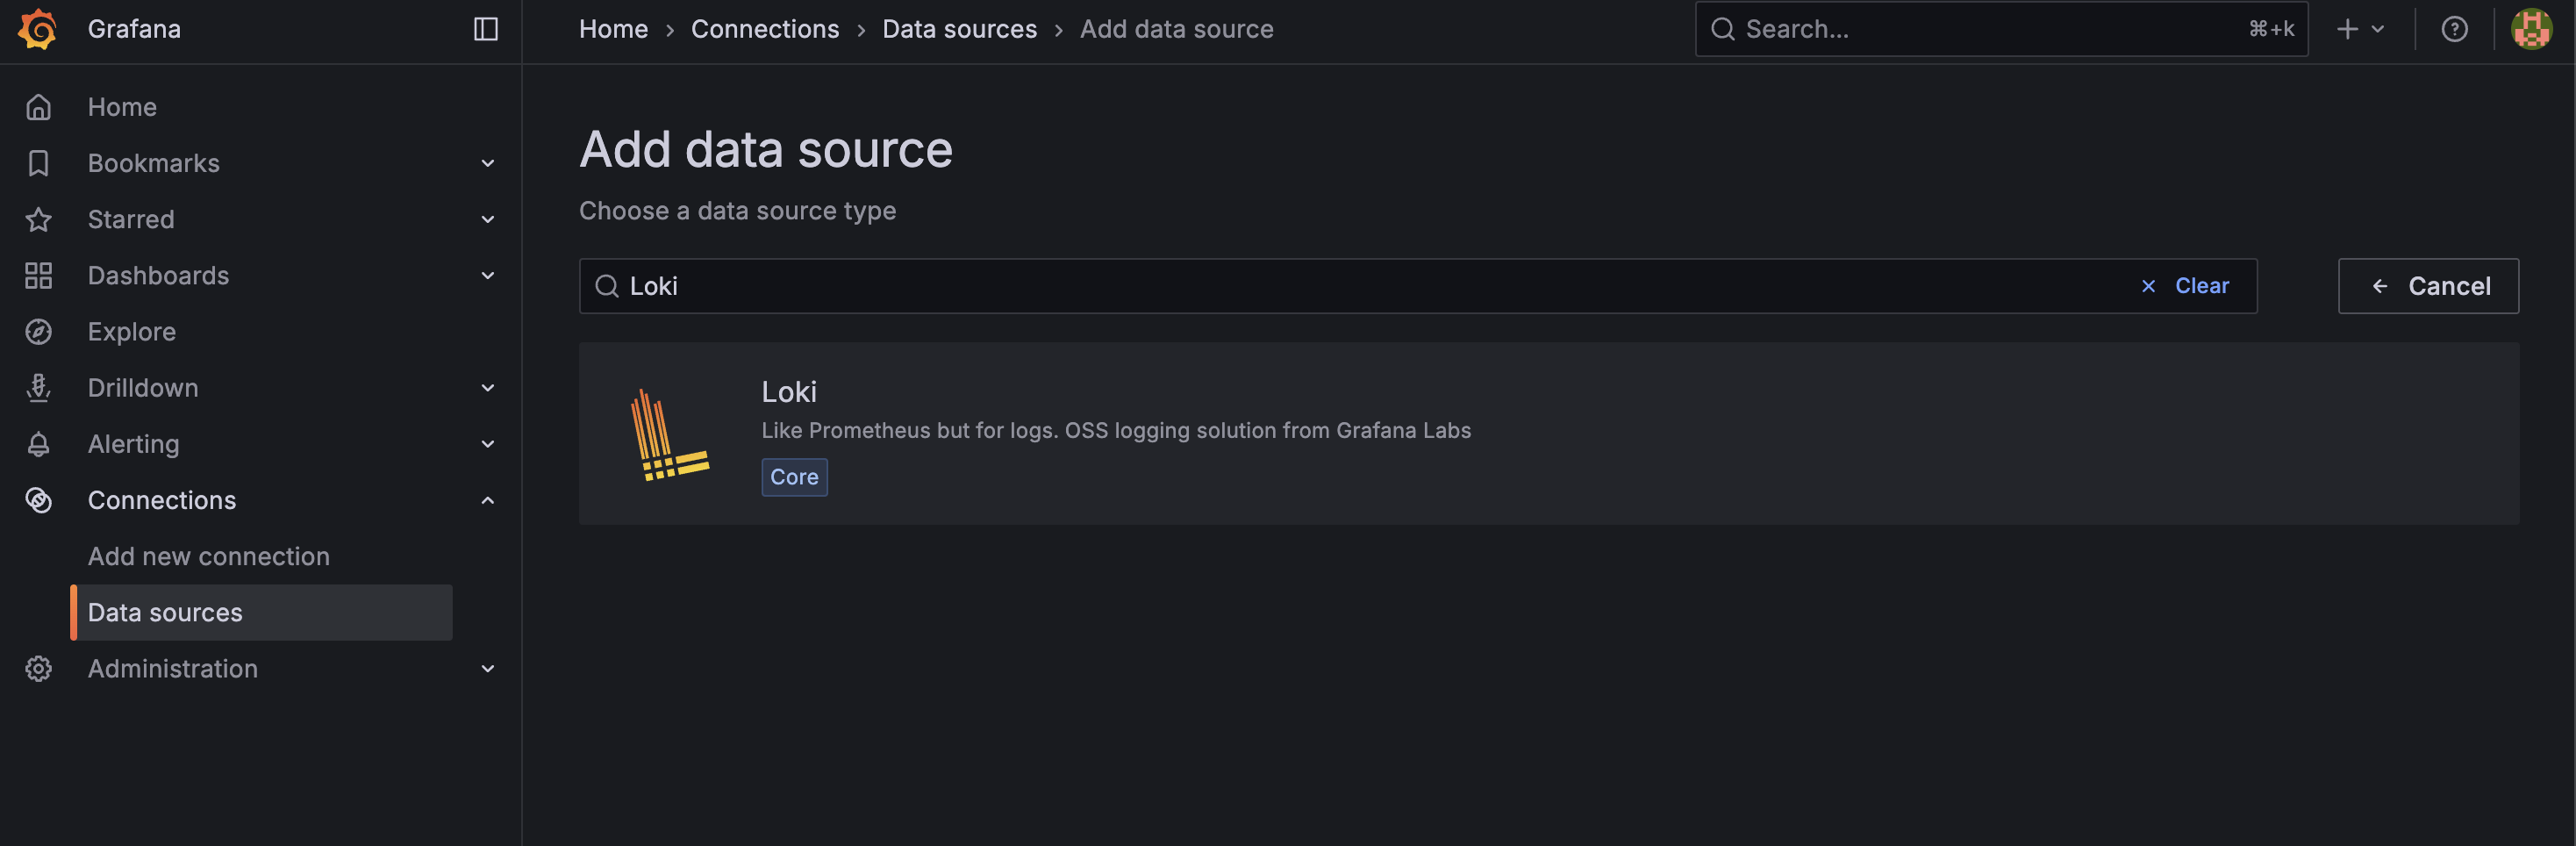
- URL에 Loki 서비스 이름 + 포트 조합으로 URL 입력

- 냅다 실패;;

- 얘도 컨테이너 로그 보니까 필요한게 없단다 (임금 안줘?? 나 일 안해!!)
level=warn ts=2025-09-12T17:30:13.420450587Z caller=loki.go:288 msg="global timeout not configured, using default engine timeout (\"5m0s\"). This behavior will change in the next major to always use the default global timeout (\"5m\")."
level=info ts=2025-09-12T17:30:13.422979658Z caller=main.go:108 msg="Starting Loki" version="(version=2.9.0, branch=HEAD, revision=2feb64f69)"
level=info ts=2025-09-12T17:30:13.423031614Z caller=modules.go:932 msg="Ruler storage is not configured; ruler will not be started."
level=info ts=2025-09-12T17:30:13.423876036Z caller=server.go:322 http=[::]:3100 grpc=[::]:9095 msg="server listening on addresses"
level=info ts=2025-09-12T17:30:13.425513172Z caller=modules.go:1140 msg="-boltdb.shipper.compactor.shared-store not specified, initializing compactor to operator on the following object stores" stores=filesystem
level=error ts=2025-09-12T17:30:13.425719932Z caller=log.go:230 msg="error running loki" err="mkdir : no such file or directory\nerror initialising module: compactor\ngithub.com/grafana/dskit/modules.(*Manager).initModule\n\t/src/loki/vendor/github.com/grafana/dskit/modules/modules.go:138\ngithub.com/grafana/dskit/modules.(*Manager).InitModuleServices\n\t/src/loki/vendor/github.com/grafana/dskit/modules/modules.go:108\ngithub.com/grafana/loki/pkg/loki.(*Loki).Run\n\t/src/loki/pkg/loki/loki.go:461\nmain.main\n\t/src/loki/cmd/loki/main.go:110\nruntime.main\n\t/usr/local/go/src/runtime/proc.go:250\nruntime.goexit\n\t/usr/local/go/src/runtime/asm_amd64.s:1598"
mkdir : no such file or directory
error initialising module: compactor
github.com/grafana/dskit/modules.(*Manager).initModule
        /src/loki/vendor/github.com/grafana/dskit/modules/modules.go:138
github.com/grafana/dskit/modules.(*Manager).InitModuleServices
        /src/loki/vendor/github.com/grafana/dskit/modules/modules.go:108
github.com/grafana/loki/pkg/loki.(*Loki).Run
        /src/loki/pkg/loki/loki.go:461
main.main
        /src/loki/cmd/loki/main.go:110
runtime.main
        /usr/local/go/src/runtime/proc.go:250
runtime.goexit
        /usr/local/go/src/runtime/asm_amd64.s:1598
level=warn ts=2025-09-12T17:31:13.679370351Z caller=loki.go:288 msg="global timeout not configured, using default engine timeout (\"5m0s\"). This behavior will change in the next major to always use the default global timeout (\"5m\")."
level=info ts=2025-09-12T17:31:13.681249815Z caller=main.go:108 msg="Starting Loki" version="(version=2.9.0, branch=HEAD, revision=2feb64f69)"
level=info ts=2025-09-12T17:31:13.681763145Z caller=server.go:322 http=[::]:3100 grpc=[::]:9095 msg="server listening on addresses"
level=info ts=2025-09-12T17:31:13.682334912Z caller=modules.go:932 msg="Ruler storage is not configured; ruler will not be started."
level=info ts=2025-09-12T17:31:13.68369274Z caller=modules.go:1140 msg="-boltdb.shipper.compactor.shared-store not specified, initializing compactor to operator on the following object stores" stores=filesystem
level=error ts=2025-09-12T17:31:13.683845171Z caller=log.go:230 msg="error running loki" err="mkdir : no such file or directory\nerror initialising module: compactor\ngithub.com/grafana/dskit/modules.(*Manager).initModule\n\t/src/loki/vendor/github.com/grafana/dskit/modules/modules.go:138\ngithub.com/grafana/dskit/modules.(*Manager).InitModuleServices\n\t/src/loki/vendor/github.com/grafana/dskit/modules/modules.go:108\ngithub.com/grafana/loki/pkg/loki.(*Loki).Run\n\t/src/loki/pkg/loki/loki.go:461\nmain.main\n\t/src/loki/cmd/loki/main.go:110\nruntime.main\n\t/usr/local/go/src/runtime/proc.go:250\nruntime.goexit\n\t/usr/local/go/src/runtime/asm_amd64.s:1598"
- 그래서 필요한 디렉토리 미리 만들어주고 권한줬음 (일반 유저 권한인 1000:1000)
mkdir -p ./loki/data/index ./loki/data/cache ./loki/data/chunks
sudo chown -R 1000:1000 ./loki/data/
- 그랬는데 이번엔 웬 디렉토리 하나 만들다가 권한없다고 에러 ㅋㅋㅋ 그냥 docker-compose.yml 옵션에도 권한줬다… 열받게 증말…


- Loki는 root 권한으로 실행되곤 해서 위처럼 일반 권한 줘선 안된대.. 그래서 그냥 다르게 줬음 (10001은 Loki 컨테이너 UID)
3. Grafana와 Loki의 권한 차이
- 1, 2 이슈 연속으로 겪으니까 '왜 Grafana는 일반 권한 주니까 되고, Loki는 일반 권한 주면 안되나?' 에 대한 의문이 들었음
- 알고보니 되게 간단한 이유였음...
- 걍 둘이 기본적으로 실행되는 권한이 다른 것임
- Grafana는 기본적으로 root가 아닌 일반 사용자(grafana:1000)로 실행되도록 설계되어있단다
- Loki는 공식 이미지가 기본적으로 10001이라는 고유 번호로 실행되도록 되어있음...
- 그런데 이제 호스트 볼륨 마운트 해가지고 권한 문제가 생긴 것이었다... (호스트와 컨테이너 각각에서 Loki 권한이 달라서)
- 컨테이너는 권한 문제로 애먹는게 종종 생기는 것 같다
- 이때 진짜 헷갈림
- 그래서 권한을 미리 확인하는게 좋은데 'id', 'whoami' 두 가지 명령어 적절히 쓰면 된다

4. CPU 코어와 전체 사용률, 2가지 따로 둔 이유
- CPU 단일 코어 모니터링
- 이거는 각 컨테이너가 CPU 코어별로 얼마나 리소스를 잡아먹는지 확인해서 아래 두가지를 확인하고자 했음
1) 서비스가 잘 돌아가는지
2) 코어 한개 이상 먹는다면 총 4코어인 내 서버에서, 어디까지 줄여야 다른 서버들에 영향을 주지 않을지
- 전체 CPU에서 비율은 생각보다 작기 때문에 좀 더 상세히 모니터링 하기 위한 용도
- 다만 아직까지 서버에 크게 영향을 줄만한 서비스, 컨테이너는 없었음 ㅎㅎ...
- CPU 전체 모니터링
- 또한 CPU 전체를 둔 이유는 서버 과부하 모니터링용이다
- CPU 점유율 90% 이상을 지속적으로 사용하는 상태가 오면 발열로 인해 스로틀링이 오기 쉬운 미니 PC라서 더더욱 필요하다 생각했음
- 대충 CPU나 RAM 점유율이 90% 이상으로 10초 이상 유지되면 알림이 오도록 세팅할 예정임
- 추후에 이 문제가 내 서비스 문제인지 외부 요청(e.g. 트래픽 몰림 or 악의적 반복 요청) 체크하기 위함도 있다 (책임 소재 파악)
5. 네트워크 쿼리문 이상해요... ㅠ
- 이것을 알게 된 것은 프로메테우스 랜 이름이 뭔가 이상함을 깨달았을 무렵이었다
# 동작함
sum(irate(node_network_receive_bytes_total{device=~"enp1s0|eth0|ens.*"}[30s])) * 8 / 1000000

# 동작 안함
sum(irate(node_network_receive_bytes_total{device=~"enp1s0"}[30s])) * 8 / 1000000
- 재밌는건 내 서버의 랜 이름은 'enp1s0'이란 것이다...

- 근데 위의 쿼리문을 보면???
- 'eth0' 키워드가 있을 때만 조회가 되더라!
- 찾아보니 node_exporter 때문이라더라...
- 일단 이 쿼리를 받고 답변을 돌려주는 것은 프로메테우스! 프로메테우스는 node_exporter가 수집해오는 데이터를 보고 정리해서 나한테 보여주는 것이다
- 이때 node_exporter가 컨테이너 안에 갇혀있다보니 실제로 쳐다보고 있는 것은 자기 컨테이너 내부의 네트워크 랜이라서 그냥 eth0임…
- 한마디로 자기만의 세계에 갇혀서 실제 바깥의 랜 이름인 'enpls0'을 보지 못하는 것

- 프로메테우스에서 직접 쿼리문을 날려보면 프로메테우스가 보고 있는 디바이스 리스트가 나오는데 여기에서 실제로 값이 송수신 되는 것은 eth0 밖에 없음을 확인할 수 있다
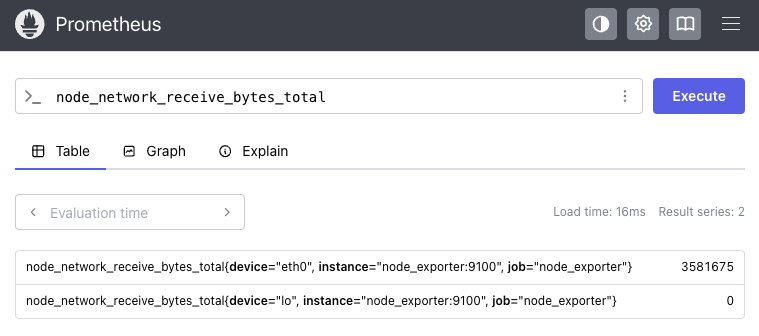
- 이걸 해결하려면 node_exporter를 host 모드로 실행시켜야함 (docker-compose.yml에 network_mode: host 추가 하면 됨)
- 그럼 이제 eth0이 실제 서버의 랜 포트로 수신되는 데이터가 맞느냐?가 핵심인데....
- 결과적으로는 '맞다'
- 쿼리 결과 오른쪽으로 주고 받은 패킷 갯수를 보면 알 수 있음
- 비유하자면 Docker 컨테이너의 eth0는 내 실제 로컬 서버의 enpls0에 연결된 가상 파이프와 같다는 것 (한마디로 택갈이)

- 외부와 데이터를 주고 받으려면 결국 여길 오가야하기 때문에 굳이 host 모드로 실행 안시키고 해도 된다는 것이다~
- 문제는 이렇게 생각하고 세팅해뒀지만, 사용량을 계속 모니터링 해보면 말이 안될 때가 많다...
- GB단위로 다운로드, 업로드하고 있는데 여전히 KB 단위라던가..
- 아무리봐도 host 모드 켜야할 것 같은데 nginx를 두고 저게 되나... 싶기하고
- 찾아보니 network_mode: host는 여러 컨테이너에 동시에 적용할 수 있다는데 포트 충돌 처리는 셀프란다 ㅋㅋ
- 수정하긴 해야할듯
'Infra > DevOps' 카테고리의 다른 글
| 오라클 클라우드(OCI) 서버 한방에 만들기 (feat. 인스턴스 생성) (0) | 2025.10.04 |
|---|---|
| 오라클 클라우드(OCI) 회원가입 한방에 뚫기 (feat. 30트 끝에 성공...) (0) | 2025.10.04 |
| 웹 VSCode 셋업 가이드 (feat. 어디서든 코딩할 수 있는 셋업) (0) | 2025.08.30 |
| 서버 보안 설정 시 주의사항과 실제 공격패턴 (feat. Fail2Ban & 내 IP 예외처리) (2) | 2025.08.07 |
| DB 자동 백업 시스템 구축하기 (feat. 모든 DB에 적용 가능) (0) | 2025.07.05 |